Carbon Brief analysis of figures in the IEA’s Renewables 2023 report show that the world is now on track to build enough solar, wind and other renewables over the next five years to power the equivalent of the US and Canada.
Rapid growth has also pushed the IEA to once again significantly upgrade its renewables forecast, adding an extra 728 gigawatts (GW) of capacity to a five-year estimate it made just a year ago. This is more than the electricity capacity of Germany and India combined.
The agency attributes this growth to plummeting costs of solar power and favourable policy regimes, particularly in China. New solar and onshore wind now provide cheaper electricity than new fossil fuel power plants almost everywhere, it says, as well as being cheaper than most existing fossil fuel assets.
Despite such accelerated expansion, the world is not currently on track to achieve the COP28 target of tripling renewables capacity by 2030, according to the IEA.
However, it proposes various measures to further increase deployment, including more finance for developing countries.
‘Step change’
Last year was a “step change for renewable power growth” as the world built an extra 507GW of renewable capacity, primarily solar and wind power, according to the IEA.
This was a 49 per cent increase on the previous year’s construction. It marked the 22nd year in a row that renewable capacity addition reached record levels.
Over the six-year period 2023-2028, an additional 3,684GW of renewables is expected to come online under the IEA’s “main” forecast. This is double the current total of renewable capacity installed globally.
In 2023, solar power both at utility-scale and on rooftops amounted to three-quarters of capacity additions, primarily due to growth in China. Over the next five years, 73 per cent of the 3,174GW of new capacity will be solar, again driven largely by China. (See: China leads.)
By Carbon Brief’s calculations, this 2024-2028 period is on track to see an extra 4,963 terawatt-hours (TWh) of electricity generation from renewable sources.
This amounts to one-sixth of the world’s electricity output in 2022. As the chart below shows, this is equivalent to covering the entire electricity demand of the US and Canada with newly-built renewables.
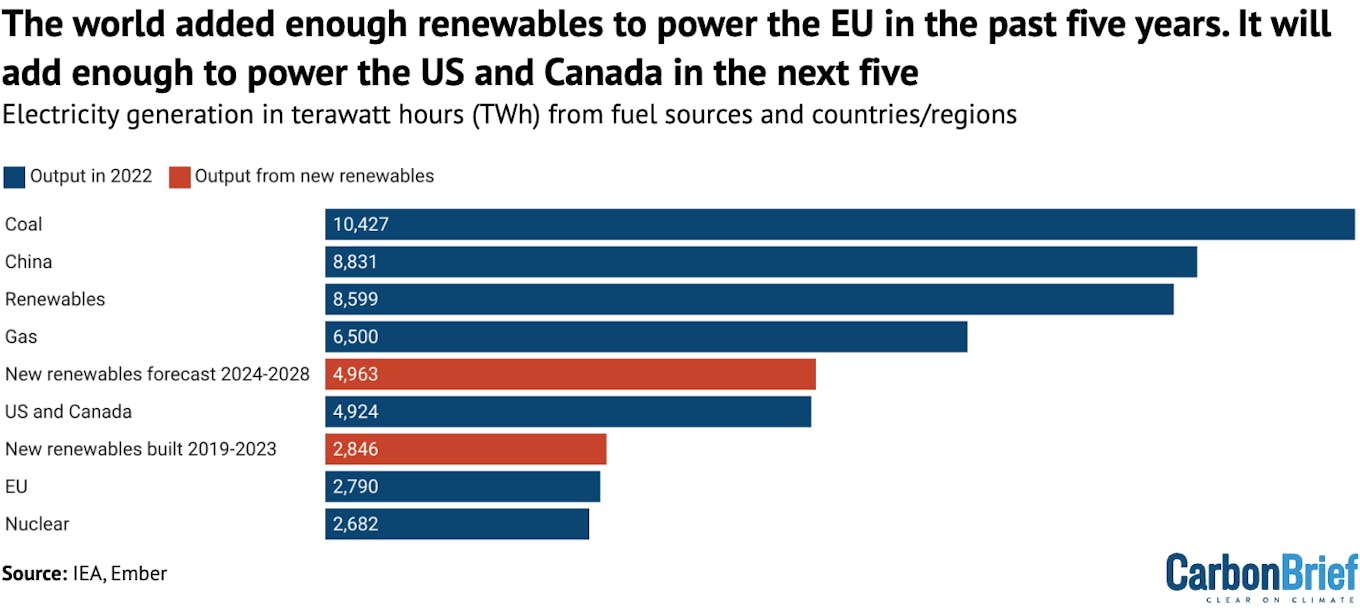
Electricity generation in 2022 (dark blue) from key fuel sources and countries, terawatt-hours (TWh). Red bars indicate estimated electricity generation from the renewables built in 2019-2023 and set to be built in 2024-2028, according to the IEA’s “main case” forecast. Source: Carbon Brief analysis by Simon Evans of figures from the IEA Renewables 2023 and Renewables 2022 reports, the IEA world energy outlook 2023 and the Ember data explorer.
By 2028, the IEA forecasts that renewables will account for 42 per cent of global electricity generation, with wind and solar power making up 25 per cent. Despite showing no growth across this period, hydropower is still expected to be the largest single source of renewable power.
Taken together, the agency says renewables will overtake coal power as the largest source of power in “early 2025”. (A year ago, the agency said renewables would become the world’s largest electricity source within three years.)
One major driver of this growth is the plummeting cost of renewables, especially solar photovoltaics (PV). Spot prices for solar modules declined by almost 50 per cent in 2023 compared to the previous year, according to the IEA.
Last year, 96 per cent of newly installed utility-scale solar and onshore wind capacity generated cheaper electricity than new coal and gas plants, according to the IEA.
Moreover, three-quarters of new wind and solar power plants provided cheaper power than even existing fossil-fuel facilities.
The other key driver is the strong policy support that renewables enjoy in “more than 130 countries”, the IEA says. It notes that “policies remain key for attracting investment and enabling deployment”, with roughly 87 per cent of the utility-scale renewable growth between 2023 and 2028 “expected to be stimulated by policy schemes”.
At the same time, the report highlights the impact of the “new macroeconomic environment” on the renewables sector, with inflation and high interest rates raising costs. Offshore wind has been hardest hit, with the IEA’s forecast for its growth outside China dropping by 15 per cent.
The report also examines renewable heat consumption and the use of biofuels. Both are set to grow considerably in the coming years, but the IEA says neither are currently on track for the trajectories seen in its net-zero scenario, which aligns with the Paris Agreement.
Record revision
As a result of this growth, the IEA has again significantly raised its forecast for renewables capacity expansion, by a record amount.
It now sees an additional 728GW being built in the 2023-2027 period compared to its forecast from 2022 – a 33 per cent increase. This is notable considering that, last year, the agency described a five-year 424GW adjustment as its “largest ever upward revision”.
The chart below shows the 120GW divergence between actual renewables growth in 2023 – some 507GW – and the forecast for that year of 387GW, made by the IEA in 2022.
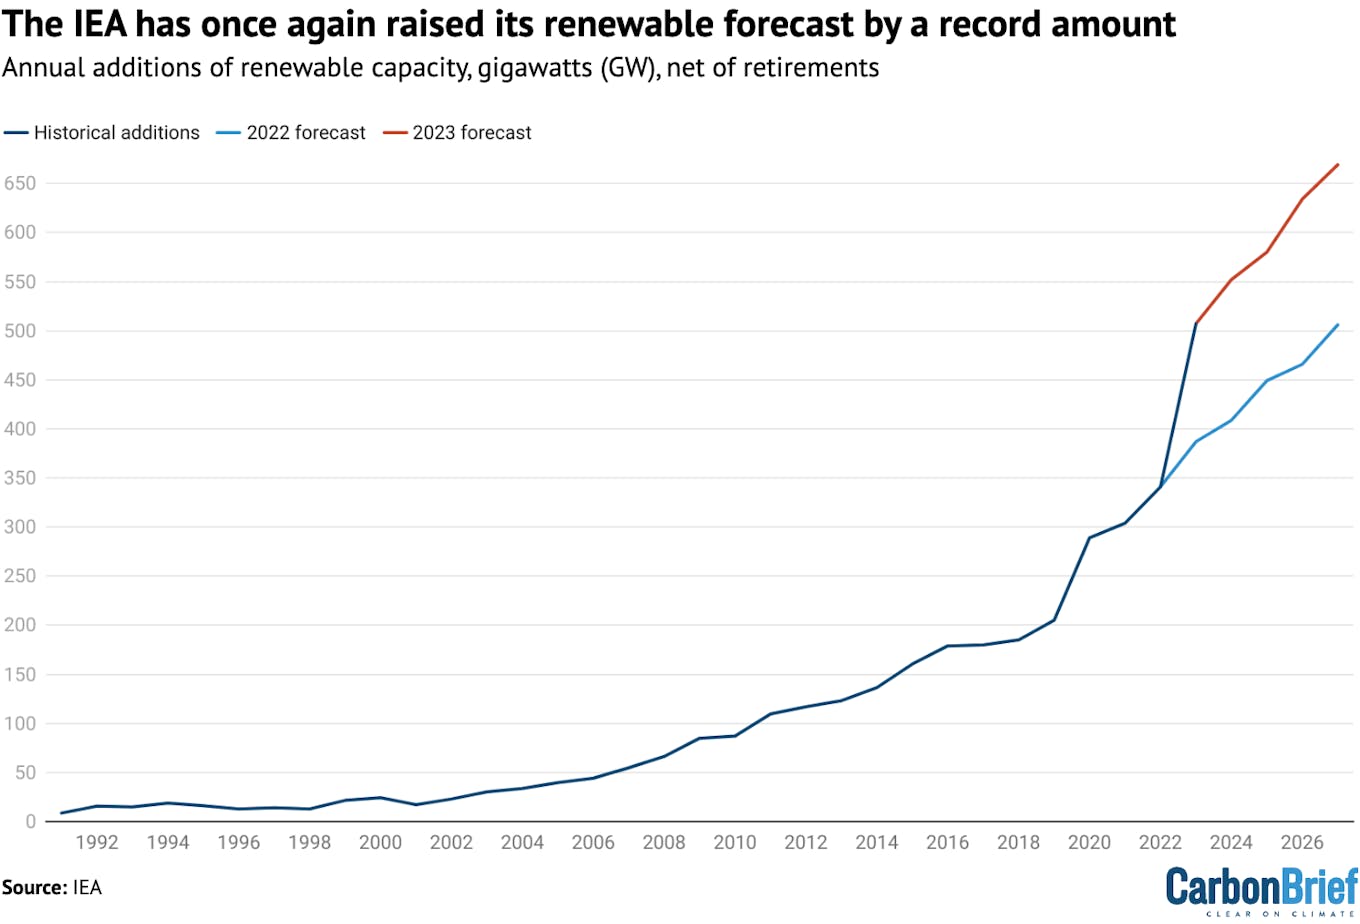
Annual additions of renewable capacity (dark blue), with forecasts from 2022 (light blue) and 2023 (dark blue). The 2023 is based on the IEA’s “main case”. Unlike in previous IEA reports, solar power data for all countries has been converted to direct current (DC), increasing capacity for countries reporting in alternating current (AC). The 2022 forecast data has been converted to allow comparison. Source: Carbon Brief analysis of figures from the IEA Renewables 2023 and Renewables 2022, and historical data from the IEA.
The IEA has a long history of making relatively conservative predictions for renewable growth that are subsequently outstripped by reality, due to a combination of more favourable policy conditions and faster-than-expected cost reductions.
Forecasts from previous IEA renewables reports issued in 2020 and 2021 showed annual renewable growth rates remaining fairly stable at around 200GW and 300GW per year for the following five years, respectively.
However, these forecasts have not been included in the chart above as, for the first time, the agency has converted all of its solar power values to direct current, resulting in slightly different GW values. This means previous forecasts are not directly comparable, although the 2022 forecast figures have been converted for this purpose.
China leads
A key conclusion from the IEA’s new report is the global dominance of China in deploying solar and other renewables, which is set to increase in the coming years.
In the period 2005-2010, China built 39 per cent of the world’s new renewable energy capacity. This increased to 47 per cent in the 2017-2022 period and the IEA expects it to rise to 59 per cent between 2023 and 2028. This can be seen in the chart below.
By 2028, the agency estimates that nearly half of China’s electricity will be generated by renewables. According to Ember, as of 2022 only around 30 per cent of China’s electricity was from renewables.
During this period, the nation is set to deploy four times more renewables than the EU and five times more than the US.
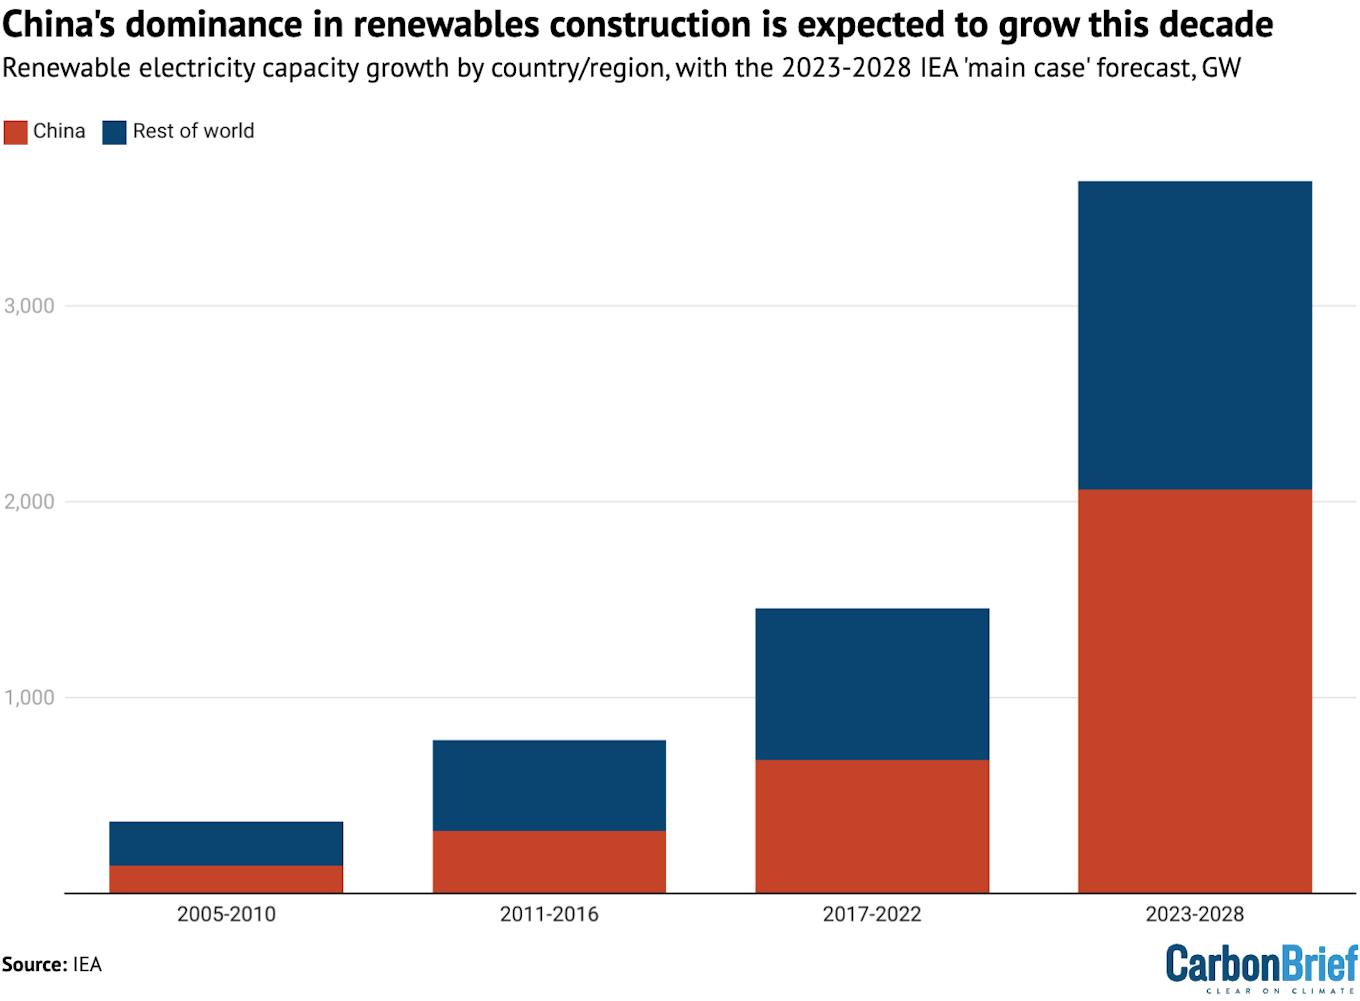
Total renewable electricity capacity growth across six-year periods, including the forecasted growth under the IEA’s “main case” for 2023-2028. Growth in China is red and growth in the rest of the world is dark blue. Source: IEA Renewables 2023.
This growth is being driven by the nation’s success in solar power manufacture and installation, according to the IEA. In “almost all provinces”, generation costs for new utility-scale solar and onshore wind are now lower than for coal, which is generally used as the benchmark for electricity prices, the agency says.
The IEA attributes this progress to policy measures, including power market reforms, green certificate systems and province-level financial support to support rooftop solar installation. It also points to a “supply glut” that has helped solar module costs “plummet drastically”.
As China accounts for 90 per cent of the upwards revision in the IEA’s forecast out to 2028, it notes that the nation’s solar achievements actually “hide slower progress in other countries”.
There have been a number of significant supportive policy changes in other countries and regions, however.
The US and the EU are expected to see renewable installation rates double across 2023-2028, compared to the previous six-year period – in both cases due primarily to solar expansion. The IEA attributes this to the US Inflation Reduction Act and supportive national policies – such as government renewable power auctions – across European nations.
The report also highlights the success of supportive policies in India and Brazil. It notes that while renewables are set to expand rapidly in sub-Saharan Africa – particularly South Africa – the region “still underperforms considering its resource potential and electrification needs”.
Tripling renewables
At COP28, nearly every government in the world agreed to a target of tripling global renewables capacity by 2030. This would bring the total to 11,000GW, which is in line with the IEA’s own net-zero scenario.
As it stands, the new report concludes that under the IEA’s “main case” forecast, shown in yellow in the chart below, renewable capacity would increase to 7,339GW in 2028.
Following that trajectory, capacity would reach around 9,000GW in 2030 – roughly an increase to 2.5 times current levels.
This forecast is based on existing policies and takes into account “country-specific challenges that hamper faster renewable energy expansion”, the IEA says.
By contrast, the IEA’s “accelerated case” involves governments “overcom[ing] these challenges and implement[ing] existing policies more quickly”.
In this scenario, shown in red below, renewables growth is around 21 per cent higher. Capacity increases to 8,130GW in 2028, putting the world on track for the tripling by 2030 target.
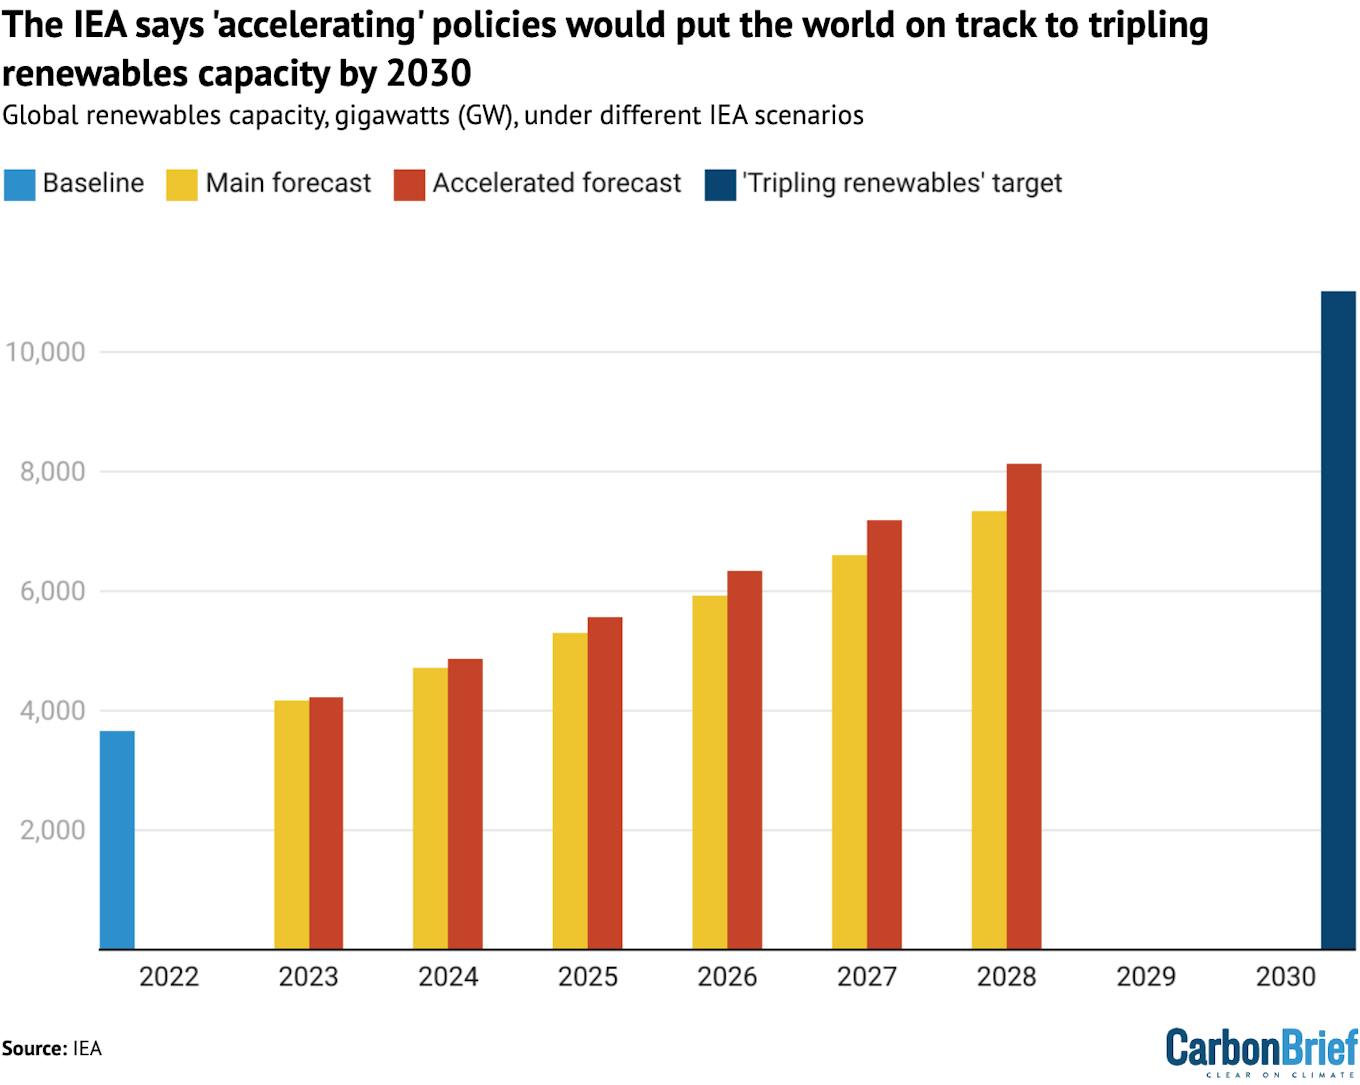
Global renewables capacity growth under the “main case” (yellow) and “accelerated case” (red) forecasts laid out by the IEA. The light blue bar shows the 2022 baseline on which the “tripling renewables by 2030” target (dark blue) is based. Source: IEA Renewables 2023.
The IEA lists a handful of broad measures that governments could take to achieve an “accelerated” trajectory.
These include: improved policy responses to the “new macroeconomic environment” such as higher inflation; more investment in grid infrastructure; and dealing with “cumbersome administrative barriers and permitting procedures and social acceptance issues”.
The IEA notes that “the lack of affordable financing remains the most important challenge to renewable project development in most EMDEs [emerging markets and developing economies], especially in countries where renewable policy uncertainties also increase project risk premiums”.
It emphasises the need to boost financing for EMDEs to overcome this barrier. Last year, renewable growth was concentrated in just 10 nations and tripling renewables requires “a much faster deployment rate…in numerous other nations”, the IEA says.
This story was published with permission from Carbon Brief.

