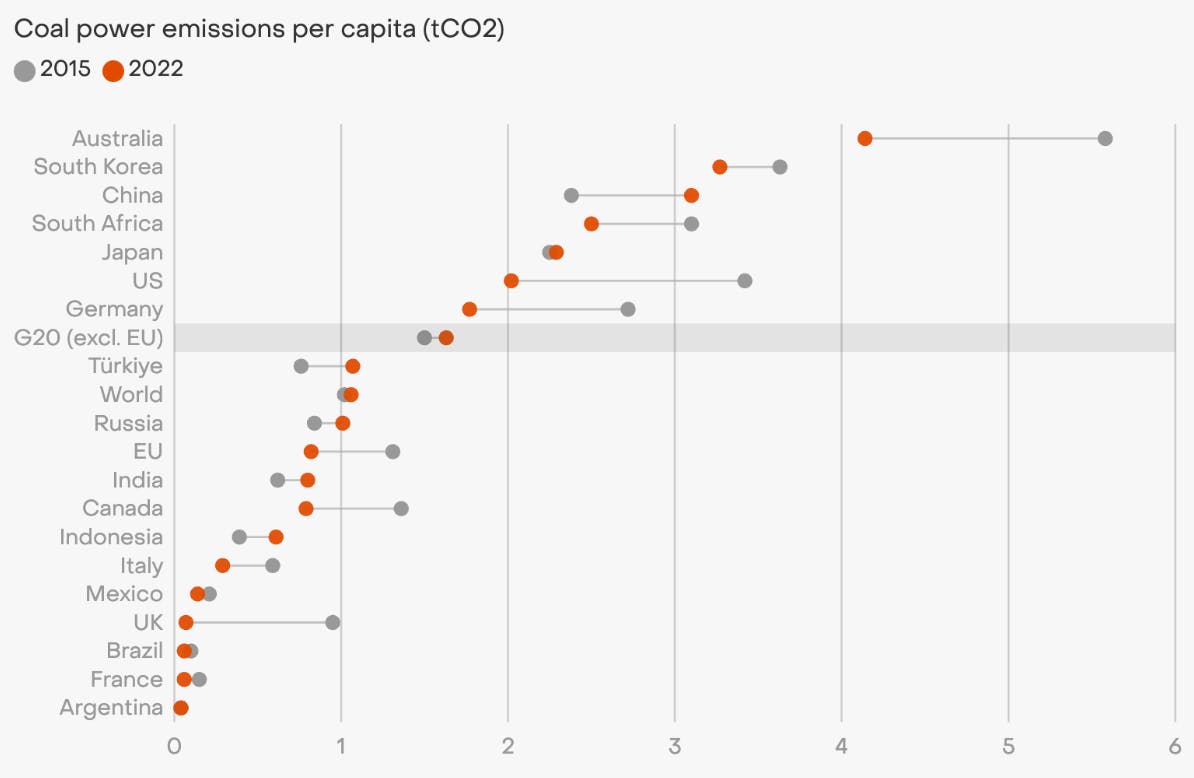
Just weeks after a much-anticipated finance deal to wean Indonesia off coal was shelved, a new study finds that the per capita coal emissions of Southeast Asia’s most populous nation have grown faster than any of the world’s largest 20 economies since the signing of the Paris climate accord.
To continue reading, subscribe to Eco‑Business.
There's something for everyone. We offer a range of subscription plans.
- Access our stories and receive our Insights Weekly newsletter with the free EB Member plan.
- Unlock unlimited access to our content and archive with EB Circle.
- Publish your content with EB Premium.
Indonesia’s per capita coal emissions grew by 56 per cent between 2015 and 2022 – an even bigger increase than regional economic powerhouses China (30 per cent) and India (29 per cent), according to a report by Ember, an energy think tank.
Indonesia is among a group of five Asian countries, including Japan, China, Vietnam and India, that is building 80 per cent of the world’s new coal plants, although Indonesia, which uses coal for 60 per cent of its energy, could retire could some plants early to meet climate commitments if its receives international aid.
A deal made with rich nations for early coal plant retirement – the Just Energy Transition Partnership (JETP) – was delayed last week after it emerged that Indonesia’s newly built captive coal plants were not factored into the conditions to access US$20 billion in climate finance.
Ember’s global insights lead Dave Jones said that giving up coal was harder for Indonesia – the world’s largest coal exporter – than any country. But Indonesia’s commitment to increase the ratio of renewables in its energy mix – to 23 per cent by 2025 – and close coals plants showed “how embedded the transition has now become” for Southeast Asia’s largest economy.
Ember’s data emerges as Indonesia’s capital Jakarta was ranked the world’s most polluted city in August, a statistic blamed partly on the eight coal-fired power stations that surround the city – more than any other capital in the world.
“
China and India are often blamed as the world’s big coal power polluters. But when you take population into account, South Korea and Australia were still the worst polluters in 2022.
Dave Jones, global insights lead, Ember
Powering Asia’s growing economies has meant that the per capita emissions of G20 countries have grown significantly over the past seven years – G20 per capita figures have reached 1.6 tonnes of carbon dioxide, compared to the global average of 1.1 tonnes of CO2 – even as some nations have cut emissions significantly by reducing fossil fuels and powering up renewables.
Japan’s per capita coal emissions have also grown, albeit at a slower pace, making it the only developed country among the G20 to see its per capita coal emissions increase since the 2015 Paris Agreement called on countries to slash emissions to keep global warming in check.
Australia and South Korea are on average the G20’s top two coal polluters, each emitting three times more coal emissions per capita than the average person in the world, although they have also reduced their coal emissions per capita by 26 per cent and 10 per cent, respectively, since 2015.

Coal per capita emissions among G20 countries, 2015-2022. Australia and South Korea are on average the G20’s top two coal polluters. Source: Ember
A bump in solar and wind has helped Australia cut its coal dependence from 64 per cent to 48 per cent of the energy mix since 2015, although the country is still well short of its 2030 goal to achieve 82 per cent share of renewables by 2030.
South Korea’s meagre renewables ratio grew from 1 per cent of the energy mix in 2015 to 5 per cent in 2022, which has helped to curtail coal’s share of the energy mix at 38 per cent.
Over half of the world’s largest economies have seen coal emissions per capita decline as a result of policies to ramp up renewables in place of fossil fuels. The United Kingdom – where coal-powered industralisation began in the 18th century – saw the most significant drop in G20 coal power emissions per capita since 2015, dropping by 93 per cent. France, Italy, and Brazil also saw big falls in coal emissions.
India’s energy choices
Per capita coal emissions have grown in India, the host of the G20 Summit on 9 September, over the past seven years. India was among the main countries to block a commitment to phase out coal at the COP26 climate talks in 2021, when 40 countries including Indonesia and Vietnam pledged to reduce consumption of the fossil fuel. However, renewable electricity is growing at a faster rate in India than any other major economy, with new capacity additions on track to double by 2026.
“India, as the host of the G20 summit, has the opportunity to assume climate leadership in the G20 and hold the bloc accountable. India’s plans to ramp up renewable energy seem to align well with the COP28 president’s call for tripling renewables by 2030”, said Aditya Lolla, Asia programme lead, Ember. “India’s early backing to this call can not only influence the G20 into action but also ensure that the developed countries bring their per capita emissions down.”
Coal-related emissions have stayed largely unchanged so far in 2023 compared to 2022, according to Ember. This year has been characterised by a large rise in Chinese coal burning, which is due to widespread drought that has resulted in very low hydropower generation, and a rebound in electricity use as lockdowns were eased at the start of the year. China’s coal-related emissions jump was mostly offset globally by large coal declines in the United States and Europe.


