The study, published in Nature, finds that ice loss from Antarctica has caused sea levels to rise by 7.6mm from 1992-2017, with two fifths of this increase occurring since 2012.
At a press conference held in London, scientists said the results suggest that Antarctica has become “one of the largest contributors to sea level rise”.
A glaciologist not involved in the paper tells Carbon Brief that the findings show “there now should be no doubt that Antarctica is losing ice due to regional climate change, likely linked to global warming”.
Melting continent
The new research was carried out by a team of scientists from the Ice Sheet Mass Balance Inter-comparison Exercise (IMBIE). The international group was established in 2011 with the aim of creating a comprehensive view of how melting in world’s polar regions could be contributing to sea level rise.
“
If these rates of sea level rise continue, they will put low-lying cities like London and New York at severe risk of increased flooding.
Alison Banwell, glaciologist, National Snow and Ice Data Center Group, University of Colorado, Boulder
In its last assessment report, released in 2012, it found that ice melt in Antarctica was causing global sea levels to rise by 0.2mm a year. (Over the past two decades, global sea levels have risen around 3.2mm a year in total.)
However, the new analysis finds that Antarctic ice melt is now driving sea level rise of 0.6mm a year—suggesting that the rate of melting has increased three-fold in just five years.
The results show that Antarctic ice melt has become “one of the largest contributors to sea level rise”, says Prof Andrew Shepherd, co-leader of IMBIE and director of the Natural Environment Research Council (NERC) Centre for Polar Observation based at the University of Leeds.
Speaking on the sidelines of a press conference held in London, he explains the significance of the new findings to Carbon Brief.
Satellite sentinels
For the new study, the researchers combined data on ice cover and weight taken from a range of satellites, including NASA’s Gravity Recovery and Climate Experiment (GRACE) mission and the European Space Agency’s CryoSat mission.
The team then used models to adjust the data to take into account physical processes that might have influenced sea level changes—such as how the ground beneath ice sheets responds to shrinking ice cover.
The resulting data reveals a “clear signal” showing an acceleration in the rate of Antarctic ice sheet melt, says Dr Erik Ivins, co-leader of IMBIE and a senior research scientist at the NASA Jet Propulsion Laboratory. He tells Carbon Brief:
“We now have a signal that is large enough that those adjustments we have to make are smaller than the signal that we’re seeing. So we’re very confident in the net result—which is Antarctica seems to be losing ice mass, enough to cause about 0.6mm of sea level rise per year.”
Breaking ice
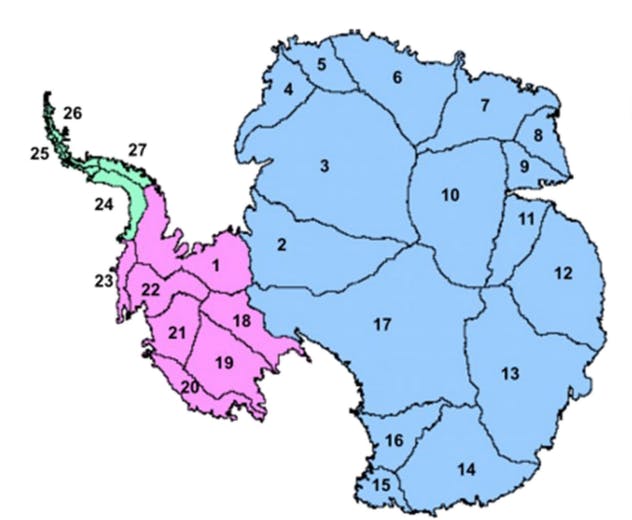
To understand why the rate of ice melt has accelerated, the researchers analysed changes to ice cover in all three Antarctic ice sheets.
The diagram below shows their locations: the Antarctic Peninsula (green), West Antarctica (pink) and East Antarctica (blue). The numbers show the location of ice sheet drainage basins.

Diagram showing the location of the Antarctic Peninsula (green), the West Antarctic ice sheet (pink) and the East Antarctic ice sheet (blue). Numbers show the location of ice sheet drainage basins. Source: Shepherd et al. (2018)
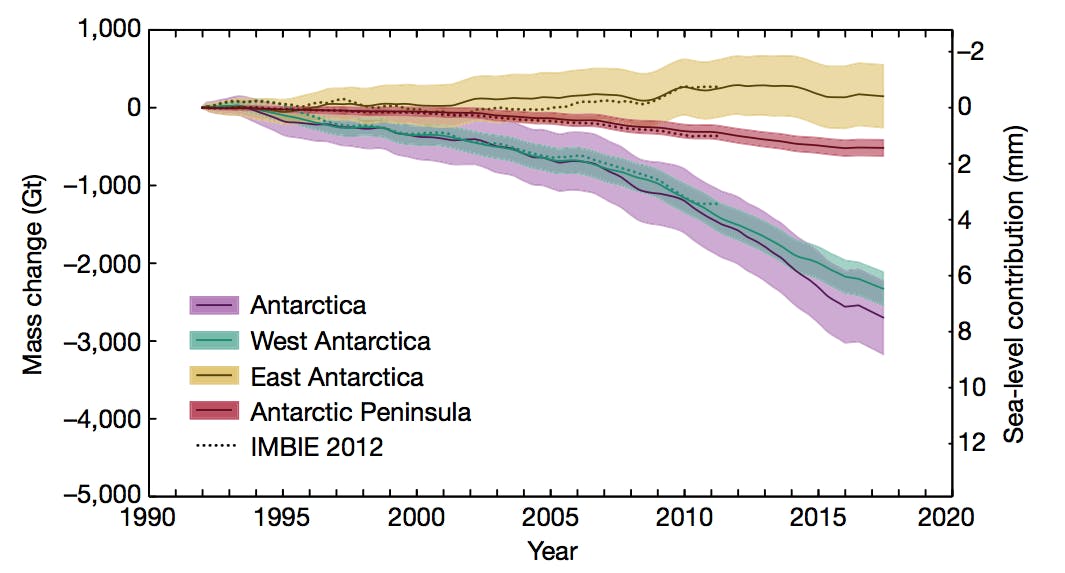
The chart below shows the total amount of ice loss from Antarctica (purple) and in each region, including West Antarctica (green), East Antarctica (yellow) and the Antarctic Peninsula (red) from 1992-2017. Results from the current study are shown against results from IMBIE’s last assessment in 2012 (dashed lines).

The amount of ice loss across Antarctica in total (purple), and in West Antarctica (green), East Antarctica (yellow) and the Antarctic Peninsula (red). Results from the current study are shown against results from IMBIE’s last assessment in 2012 (dashed lines). Shading shows the range of uncertainty. Source: Shepherd et al. (2018)
The results show how, in the past decade, West Antarctica has experienced the highest volume of ice loss.
The animation below shows changes in ice sheet thickness across West Antarctica, with red showing reductions in thickness and blue showing gains.
The following chart indicates the extent to which each Antarctic region has contributed to recent sea level rise. It shows that, over the past decade, ice loss from West Antarctica contributed the most to sea level rise.
The reason that West Antarctica may be more vulnerable to melting than other regions is because it is largely made up of “marine-based” glaciers, which sit on land below sea level.
Where the face of a glacier meets the ocean, warm water can melt it from underneath, gradually forcing back the “grounding line”, which is where the glacier sits on the seabed.
Previous research suggests the global warming could be driving up ocean temperatures and causing changes to ocean currents, which deliver warm water to the sea surface.
Around 75 per cent of the glaciers in West Antarctic ice sheet are marine-based, compared to just 35 per cent of glaciers in East Antarctica, according to the latest assessment report from the Intergovernmental Panel on Climate Change (IPCC).
Icy forecast
Though the study did not seek to make future predictions about how Antarctic melting could influence sea level rise, it does cause “concerns for the future”, Shepherd says:
“The three-fold increase puts Antarctica now in the frame as one of the largest contributors to sea level rise. The recent acceleration makes us have concerns about the future.”
In the video below, Ivins explains that Antarctic melting could become a far larger driver of sea level rise than melting from Greenland – which was once thought to be the biggest driver of global sea level rise.
The findings are “significant” because they encompass “new satellite missions and advances in geophysical techniques and corrections”, says Dr Alison Banwell, a glaciologist at the National Snow and Ice Data Center Group (NSIDC) at the University of Colorado, Boulder, who was not involved in the research. She tells Carbon Brief:
“There now should be no doubt that Antarctica is losing ice due to regional climate change, likely linked to global warming. If these rates of sea level rise continue, they will put low-lying cities like London and New York at severe risk of increased flooding.”
The research is part of a special issue in Nature, which includes five papers exploring Antarctica’s past, present and possible futures.


