BP says in its energy outlook 2019 that this increase in demand is a necessity for rising prosperity, but an impediment to the Paris climate goals. This is because even rapid uptake of renewable and other low-carbon sources is insufficient to cover rising energy demand.
As a result, according to the outlook, there is a continued need for large amounts of fossil fuels.
Yet cracks are starting to appear in this foundational assumption for BP and other prominent energy outlooks. Indeed, BP’s latest outlook cuts the rate of demand increases in its main scenario, compared to previous editions, and includes others where growth is even slower.
Meanwhile, an alternative outlook published this week by the consultancy McKinsey suggests global demand could stop rising in the 2030s, after more than a century of sustained growth.
Carbon Brief runs through the key findings from BP’s energy outlook 2019 and explores what it might mean for fossil fuels and the climate, if global energy demand stops growing.
Rising demand?
For most of human history, new sources of energy have been the motive force of a growing global economy. From the discovery of fire through to the steam engine and the rise of the automobile, energy has been inextricably linked with human advancement.
This is reflected in the data, which shows that global energy demand increases as the economy grows. Other than during major recessions, global energy use has risen almost uninterrupted.
It is something of an economic orthodoxy – shared by the likes of BP, Shell and most major energy agencies around the world – that this link between energy and GDP will continue into the future.
According to this view, demand will continue to rise because of a growing population, with rising incomes and needs for energy – even if there are “aggressive” improvements in energy efficiency.
Spencer Dale, BP group chief economist, says in a short video published ahead of the BP launch:
“It seems clear that the world will need more energy. In the scenarios we look at, global energy demand increases from between 25-35 per cent by 2040. In this year’s outlook, we look at the relationship between increases in energy consumption and human development in some of the poorest countries in the world. And we show how increases in energy consumption tend to go hand in hand with improvements in human progress and wellbeing. The world needs more energy to continue to grow and prosper.”
The chart below reflects this view, showing global energy demand growth in BP’s main “emerging transition” scenario in red, alongside similar recent outlooks for continually rising demand from Shell, Equinor and the International Energy Agency (IEA), shown in shades of blue.
Not everyone agrees with this view, however. Global energy demand could stop growing in the 2030s at just over 10 per cent above 2016 levels, according to consultancy giant McKinsey. It published its own global energy perspective 2019 earlier this week, shown on the chart below in orange.
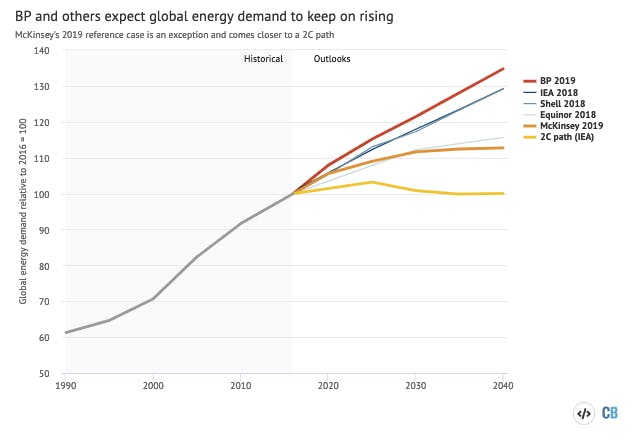
Global primary energy demand growth in the BP Energy Outlook 2019 “emerging transition” scenario (red), compared with other views (demand shown relative to 2016=100). The 2018 IEA “new policies scenario”, Shell “sky” scenario and Equinor’s “reform” are in blue. McKinsey’s “reference case” 2019 is in orange and the 2018 IEA “sustainable development scenario” in yellow. Historical data is show in grey. Note that each organisation uses a different method to convert non-fossil energy into primary energyequivalents. This means the comparison in the chart is an approximation. Source: BP, Shell, IEA, Equinor, McKinsey and Carbon Brief analysis. Chart by Carbon Brief using Highcharts.
Rising energy demand would mean a larger space for continued fossil fuel use – and CO2 emissions – even if there is a rapid rollout of renewables. This is shown in the details of BP’s 2019 outlook, set out in more detail below.
On the other hand, pathways limiting warming to 2C above pre-industrial temperatures or lower – as required by the Paris Agreement – tend to have lower energy demand. Indeed, the IEA’s 2C “sustainable development scenario” has lower demand than the other outlooks (yellow line, above).
This year, BP has included alternative scenarios alongside its main “emerging transition” outlook, where demand rises a third by 2040. For example its “more energy” scenario sees demand in 2040 rise 65 per cent compared to today’s levels, whereas in “rapid transition” the increase is just 21 per cent.
McKinsey goes even further and says that demand could stop growing in the 2030s at around 10 per cent above current levels, “despite strong population expansion and economic growth”. This would be “the first time in history that growth in energy demand and economic growth are ‘decoupled’”.
Crucially, McKinsey’s lower outlook for global energy demand growth does not come at the expense of reduced economic output or slower advances in human development.
Instead, the rapid uptake of renewables is a key driver of this decoupling, McKinsey says, as they often replace fossil fuels that are burned with low efficiency. Greater energy efficiency is another factor, it adds, offsetting the effects of population growth and rising incomes:
“Energy intensity falls as service industries take up a larger share of the global economy, and energy use segments continue to become more efficient. More efficient technologies [will] become available across sectors, driving down energy consumption even in large industrial countries like China.”
McKinsey notes that it has revised down its outlook for global demand in future “reflecting rapid developments in energy systems”. Others have done the same, including BP, which has shaved 3 per cent off demand in 2040 compared to its 2013 number. Yet it still sees demand growing indefinitely.
There are already national examples of the “decoupling” McKinsey describes. The UK’s energy demand is a fifth lower than in 2005 and electricity generation is at its lowest level since 1994, even as the economy has continued to grow. Many other developed nations show similar signs.
Notably, although it disagrees with McKinsey’s view of energy demand growth, BP’s 2019 outlook does recognise the changing nature of global economic development. As Reuters reports, for example, it sees energy growth in China “sharply decelerating as its economic expansion slows”.
Energy mix
BP’s assumption that global energy demand will keep on rising indefinitely, even in its “rapid transition” scenario, is a central component of its 2019 outlook. It means that there is an increasing need for the fossil fuels it produces, even as low-carbon sources of energy surge ahead.
The chart below shows demand for each fuel in its main “emerging transitions” scenario. Even as wind and solar expand at an unprecedented pace (yellow line), BP sees gas rising almost as quickly (light blue). Oil grows to a peak in the mid-2030s (orange) and coal only falls slowly (black).
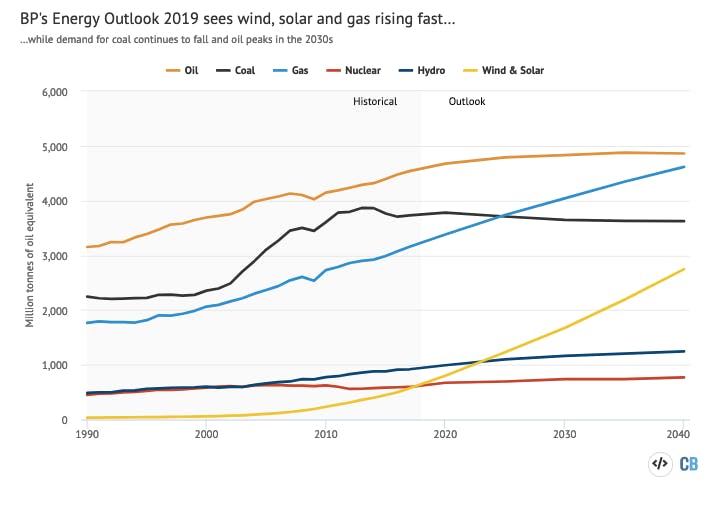
Global energy demand per fuel in BP’s “emerging transitions” scenario (millions of tonnes of oil equivalent). Source: BP energy outlook 2019 and BP statistical review 2018 for annual historical figures. Chart by Carbon Brief using Highcharts.
It is notable that, despite BP’s strong underlying energy demand assumptions, coal use never regains its 2013-14 peak and oil use stops going up during the 2030s. This is because of the rapid rise of renewables, in particular wind and solar.
Changing outlook
Indeed, BP has once again raised its renewables outlook in 2019, with a 9 per cent increase for 2040 compared to the 2018 figure, shown in the top left chart, below.
The other charts below show changes for each fuel since BP’s outlook was first published in 2011, with oil (top right) and coal (bottom left) seeing particularly notable shifts.
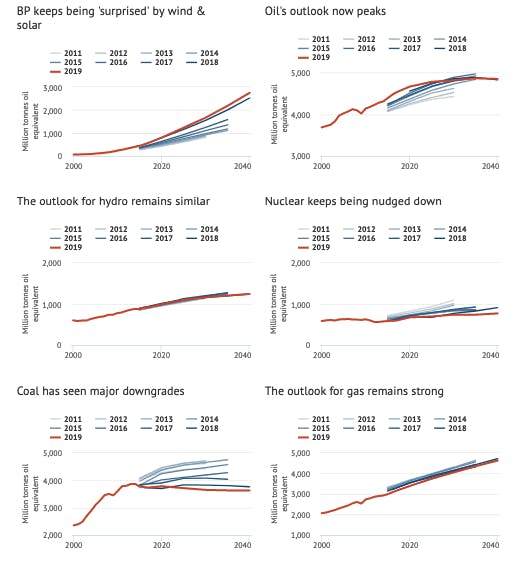
BP’s expectations for each fuel since its energy outlook was first published in 2011. Red lines show the main 2019 “evolving transition” view for each fuel, in millions of tonnes of oil equivalent (Mtoe). Blue lines show previous years’ outlooks. Wind and solar includes other non-hydro renewables but excludes biofuels. Note the truncated and variable y-axes. Source: BP energy outlook 2019, previous outlooks and Carbon Brief analysis. Chart by Carbon Brief using Highcharts.
Explaining its upwards revision for renewables back in 2017, BP said that cost reductions for wind and solar “continue to surprise on the downside”. The surprise appears to be ongoing, as BP raised its renewable outlook again in 2019 having already done the same in every previous edition.
BP now says wind and solar output will reach 2,800m tonnes of oil equivalent (Mtoe) in 2040. This is 50 per cent higher than its implied 2017 number and more than double the equivalent from 2014.
Meanwhile, BP says coal demand will fall to 3,600Mtoe in 2040, some 4 per cent lower than what it expected last year and more than a quarter below the figure implied by its 2014 outlook.
Demand dents fossils
As the Financial Times reports, BP believes oil demand will prove resilient over the next 20 years, even if global climate goals are met. Yet as noted above, this view is underpinned by BP’s assumption of ever-increasing energy demand growth.
Although BP’s “rapid transition” scenario has lower growth than its main outlook, it nevertheless sees global energy demand increasing by more than a fifth by 2040. In contrast, the McKinsey scenario shown in the first chart, above, shows that global demand could stop rising in the 2030s.
To explore the potential implications of these diverging views on energy demand, the chart below shows BP’s main outlook for fossil fuels with solid lines. Here, demand for oil increases to a mid-2030s peak (orange), coal declines gradually (black) and gas enjoys rapid growth (light blue).
The chart compares these trends to a crude, but illustrative alternative where overall global energy demand stops rising in the 2030s, in line with the McKinsey view of the future (dashed lines).
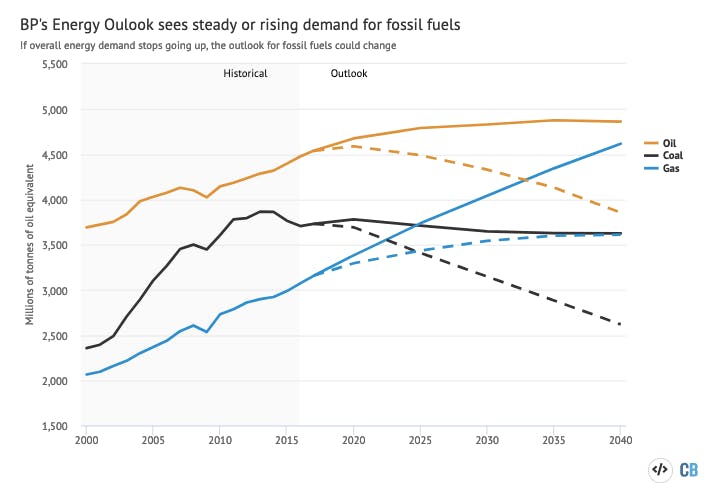
BP’s main 2019 outlook for fossil fuels (solid lines) compared to a scenario where overall energy demand stops going up after 2030, in line with the McKinsey “reference case” 2019 (dashed lines). This illustrative alternative scenario assumes non-fossil sources of energy evolve, according to BP’s outlook, while reduced demand is divided equally between the three fossil fuels. In reality, it is likely that lower overall demand would weigh more heavily on some fuels than on others. Source: BP, McKinsey and Carbon Brief analysis. Chart by Carbon Brief using Highcharts.
This chart shows how lower global energy demand growth could have seismic effects on the fossil fuel industry. Relatively steady or rising demand for coal, oil and gas could be converted into stagnation or steep declines, though the effects are likely to differ from the illustrative ones here.
Moreover, this chart shows how a peak in global energy demand would have important knock-on effects for CO2 emissions. Neither BP’s “rapid transition”, nor McKinsey’s “reference case”, nor the illustrative scenario, above, would see CO2 fall in line with the goals of the Paris Agreement.
Nevertheless, improved energy efficiency to limit demand is a common feature of almost all pathways to meeting those goals and is, therefore, a key component of global climate policy.
This story was published with permission from Carbon Brief.

