Heatwaves on both land and ocean can have deadly impacts. However, efforts to predict imminent ocean heatwaves still lag behind research predicting land-based extremes.
The new study, published in Nature, provides the foundation for an operational marine-heatwave forecasting system that can predict oncoming marine heatwaves between one and 12 months before they hit.
The forecasts show the highest “skill” in the tropics, but are less promising for much of the Southern Ocean – which often experiences intense, but short-lived marine heatwaves – the authors find. The authors add that the “highest prediction skill” in the 30-year record was during the extreme 1997-98 and 2015-16 El Niño events.
Reliable marine heatwave forecast systems can be valuable tools for increasing the resilience of marine ecosystems. For example, advanced warning of heatwaves could allow fisheries to protect species from being overfished when high ocean temperatures reduce productivity.
“I think it is crucial that forecast developers work closely with the community that may use the forecasts – we can help in the decision making,” a scientist not involved in the study tells Carbon Brief.
“
By comparing retrospective forecasts with past observations, researchers can assess the quality of the predictions, and determine to what extent they provide trustworthy information.
Dr. Markus Donat, climate scientist, Barcelona Supercomputing Center
Marine heatwaves
As the climate warms, periods of extreme heat are becoming more common, frequent and long-lasting.
While the severe consequences of land heatwaves regularly attract newspaper headlines around the world, marine heatwaves are often less high profile. As such, global efforts to monitor ocean heatwaves still lag behind those of their land-based counterparts.
Nevertheless, the impacts from marine heatwaves can be stark. In 2015-16, “the blob” swept across the northern Pacific ocean. At its peak in 2015, this marine heatwave covered about 4m square kilometres (km2) of ocean, stretching from Alaska to the Mexican state of Baja California.
The “deadly” event had “huge” consequences for marine ecosystems. The high temperatures caused a drop in primary production – the process by which marine plants produce food to live and grow – forcing fish and other organisms to move in search of cooler habitats. Meanwhile, harmful algal blooms spread across the surface of the water.
Disruption to the local ecosystem caused a mass die-off of fish, mussels and crabs, and thousands of starving sea lion pups washed up on beaches. The “ecological pileup of unprecedented changes” also forced whales closer to shore to feed, leading to a record number becoming entangled in crab fishing nets. Meanwhile, a single coral bleaching event in 2016 saw 30 per cent of corals in the Great Barrier Reef die.
Marine heatwaves have already driven direct economic losses of more than $800m through damage to industries such as tourism and fishing.
Seasonal forecasts
Scientists use seasonal forecasting to predict upcoming global weather events, such as unusually warm ocean temperatures. Today, such predictions are provided by a number of forecasting centres around the world.
Dr Markus Donat – a climate scientist at the Barcelona Supercomputing Center who was not involved in the study – wrote a News and Views piece for Nature on its findings. He explains that seasonal climate predictions “are made using numerical models that represent our understanding of the physical climate system”. Donat adds:
“[Forecasting] centres also produce large sets of retrospective forecasts, which are initialised from conditions in the past. By comparing retrospective forecasts with past observations, researchers can assess the quality of the predictions, and determine to what extent they provide trustworthy information.”
The new study uses seasonal forecasts to provide the foundation for an operational marine-heatwave forecasting system and then to predict how likely marine heatwaves were during 1991-2020. The authors define “marine heatwaves” as times when monthly average sea surface temperatures are in the warmest 10 per cent of those recorded over this time period.
To do this, they ran a collection of retrospective seasonal climate predictions, using six different global climate models, with monthly sea surface temperature data. They then looked at forecasts for the entire globe, every month for the past 30 years, and assessed the “skill” of the forecast by comparing it to actual observations of heatwaves.
Dr Michael Jacox – a research oceanographer from the National Oceanic and Atmospheric Administration – is the lead author on the study. He tells Carbon Brief that the paper is “the first comprehensive analysis of how well models can predict marine heatwaves around the globe”.
“This is a very exciting paper,” Dr Alistair Hobday – a research scientist at the Commonwealth Scientific and Industrial Research Organisation, who was not involved in the study – tells Carbon Brief. He adds:
“The use of multiple models in the paper makes the results stronger – and confidence in the results overall.”
‘Skilful’ predictions
The study finds that the onset, intensity and duration of marine heatwaves is often predictable up to a year in advance, when using seasonal forecasts. However, factors including heatwave intensity, season and lead time – the time between the forecast being made and the event happening – affect the forecast skill.
For example, the authors find that shorter “lead times” offer more skilful predictions. This is similar to weather forecasts, which are generally more certain for the next day than they are for the next week.
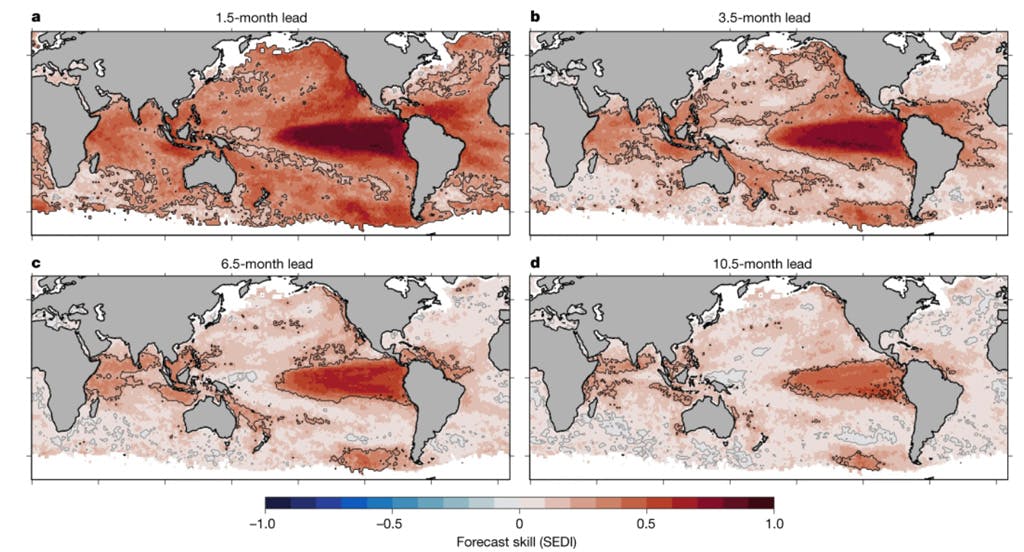
The map below shows the forecast skill of the seasonal forecast system for four different “lead times” – 1.5, 3.5, 6.5 and 10.5 months. Scores range from −1 (blue), indicating no skill, to 1 (red), indicating perfect skill. Darker reds indicate higher level prediction skill.

Maps indicate marine heatwave MHW forecast skill of different lead time occurrence from six global climate forecast systems for the period 1991-2020. Scores range from −1 (no skill) to 1 (perfect skill). Source: Jacox et al (2022).
Marine heatwave forecasts have “significant skills” in all regions of the global ocean at lead times up to two months, the authors find. And in large areas of the ocean, skillful predictions can still be made with lead times of three-to-six months.
However, the study finds that at 10.5 month lead times, “significant skill is confined primarily to the eastern tropical Pacific and portions of the Indian Ocean, Indo-Pacific region and high-latitude eastern Pacific”.
Meanwhile, “relatively poor” forecast skill is seen in much of the Southern Ocean and in “western boundary current regions”, where the marine heatwaves are short-lived, regardless of their intensity.
The researchers find that forecasts are most skilful when initialised in the northern-hemisphere winter for some regions – for example, the north-east Pacific and Indian Oceans. However, they tend to be more skilful when initialised in northern-hemisphere spring in the tropical Atlantic, and summer in the eastern tropical Pacific.
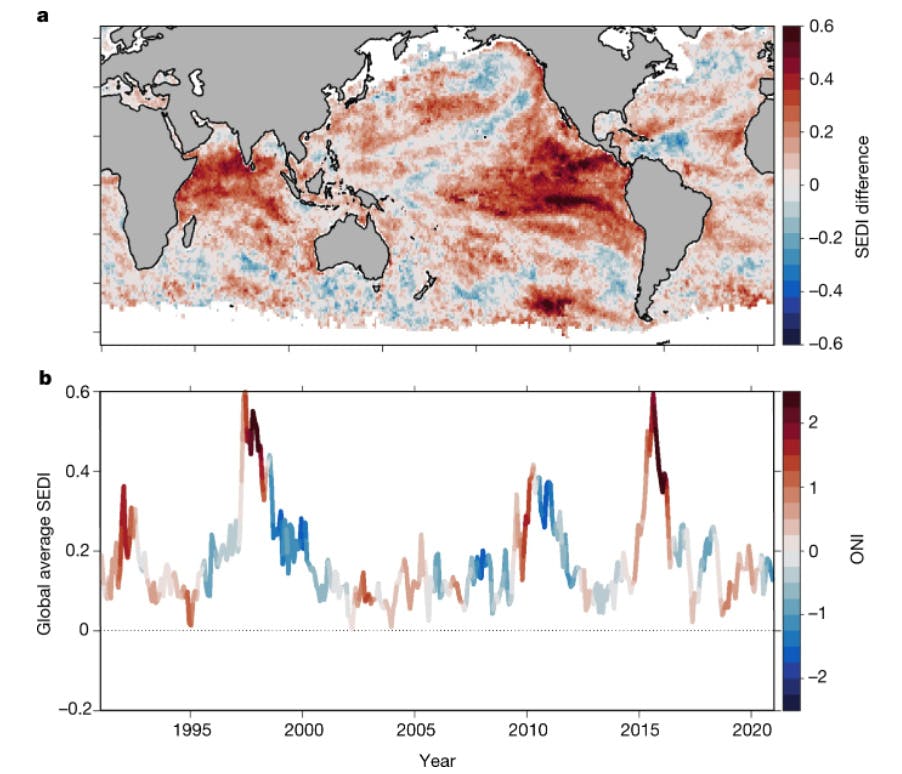
The study also finds that high global-forecasting skill is seen when the El Niño Southern Oscillation (ENSO) is in an “active” state – that is, when an El Niño or La Niña event is occurring, rather than ENSO’s “neutral” state. The 30-year record saw the extreme 1991-92 and 2009-10 El Niño events and the 1998-2000 and 2010-11 La Niña events.
In the figure below, the map (top) shows the difference in 3.5-month lead forecast skill (SEDI) when ENSO is in an active state compared to a neutral state. Red indicates high skill and blue indicates low skill. The graph (bottom) shows a time series of globally averaged 3.5-month lead forecast skill. Red indicates a high “oceanic Niño index” (ONI) and an El Niño event and blue indicates a low ONI and a La Niña event. A high value on the y-axis indicates high forecasting skill (SEDI).

The map (top) shows the difference in 3.5-month lead forecast skill (SEDI) when ENSO is in an active state compared to a neutral state. Red indicates high skill and blue indicates low skill. The graph (bottom) shows a time series of globally averaged 3.5-month lead forecast skill. Red indicates a high ONI and an El Niño event and blue indicates a low ONI and a La Niña event. A high value on the y-axis indicates high forecasting skill (SEDI) Source: Jacox et al (2022).
Early warning
Accurately forecasting marine heatwaves has been described as, potentially, “a major win” for decision-makers. For fisheries, for example, advance warning could allow particular species to be protected from being overfished when heatwaves reduce productivity, writes Donat in his News & Views article, or “preparing to harvest more when productivity is enhanced”. Meanwhile, forecasts could also inform the allocation of resources to monitor sensitive sites.
However, the actions taken by decision-makers depend on the level of risk that they are willing to tolerate in their decision to take action. In his article, Donat explains:
“Users with a high tolerance to the risks involved might wish to avoid action, taking into account the possibility that a predicted marine heatwave might not occur. Those with lower risk tolerance might prefer to take action even when the probability of a marine heatwave occurring is low.
“The most suitable decision threshold will be user-specific and will depend on balancing the cost of action with the cost of potential loss or damage in the case of inaction.”
As such, the study notes, end-users need to establish “thresholds” for when action should be taken, based on the level of risk that they are willing to accept.
A low threshold means that action is taken even when the likelihood of a marine heatwave occurring is low. This risk-averse approach means that the rate of false negatives – in which decision-makers fail to take action when a marine heatwave occurs – is low. However, it is also likely to result in more false positives – when action is taken, but a marine heatwave does not materialise.
By contrast, a higher temperature threshold makes it more likely that action will not be taken when a heatwave occurs, but it minimises the rate of false positives.
“Individual users must balance the risk of inaction with the risk of unnecessary action,” the study says.
The test forecast system outlined in the paper “will give marine stakeholders a lot to think about”, Hobday tells Carbon Brief.
“Now that we have developed the forecasts, we are eager to work with people who can benefit from using them,” Jacox tells Carbon Brief. He adds:
“As a first step, we created a website where anyone can go and see forecasts of marine heatwaves for the next year.”
The authors note that regionally tailored marine heatwave predictions can be generated – but “anticipate that they would supplement, rather than replace, global forecasts”.
The study adds that in the future, marine heatwave forecasts could be expanded upon – for example, including coupled-climate forecasts from additional modelling centres, and collaborating internationally. Other methods – such as machine-learning techniques – could also be adopted, it says.
This story was published with permission from Carbon Brief.


