That’s one of the most striking messages from World Energy Investment 2017, published today. The report, now in its second year, offers a comprehensive picture of energy investment from fossil-fuel extraction through to transport, energy efficiency and power networks.
The IEA report is not only backwards looking, reporting money already invested. It also offers a glimpse of forthcoming trends, by reporting the value of decisions taken to invest in future.
Overall, investment fell again last year, as the oil-and-gas sector continued to cut back in response to low prices. Steady investment in renewables, along with falling costs, saw 50 per cent more capacity being added in 2016 than in 2011. But gains for low-carbon wind and solar are being offset by declines in hydro and nuclear.
Carbon Brief has seven charts with the key messages from this year’s energy investment report.
“
This century, so far, was the century of coal. From 2000 onwards, coal was the single biggest source of the growth of power generation, especially in China and India. This coal investment wave, in our view, is coming to an end.
Laszlo Varro, chief economist, International Energy Agency
Fossil fall
For the second year running, global investment in new energy supplies fell steeply, the IEA report says. This decline was mainly due to the oil-and-gas sector, where investment has fallen 44 per cent in two years on the back of the collapse in oil prices.
These cuts have seen fossil fuels’ share of investments in new energy supplies fall below 60 per cent for the first time, as the chart below shows.
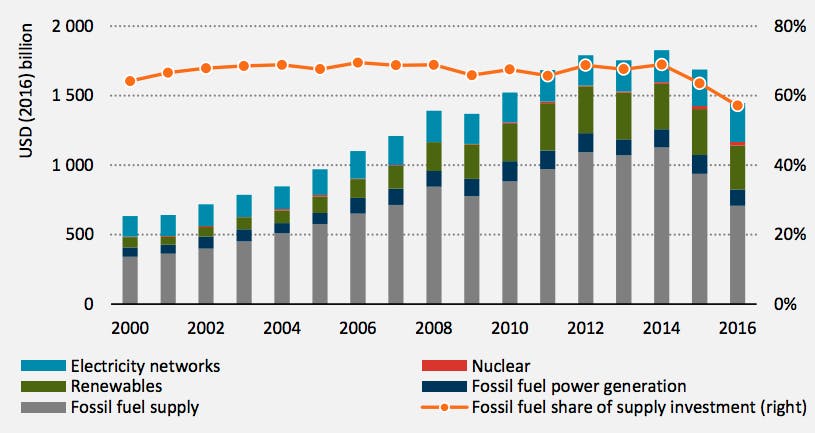
Global investment in energy supply, by fuel, 2000-2016 (columns) and the share of investment going towards fossil fuel supplies (orange line). Source: IEA World Energy Investment 2017.
Renewable investment is delivering ever more bang for its buck. While inflation-adjusted investment fell 3 per cent between 2011 and 2016, the amount of capacity added rose by 50 per cent, reaching a new record, and the expected power output increased by 35 per cent.
The most dramatic cost reductions have been for solar, down 20 per cent in each of the past two years, and batteries, down 19 per cent per year for five years, with another one-third reduction expected by 2020. Investment in grid-scale battery storage is beginning to take off, rising six-fold in five years to nearly 600 megawatts (MW) in 2016.
Electric history
As oil-and-gas spending fell again in 2016, the electricity sector took the largest share of global energy investment “for the first time in history”, said IEA chief economist Laszlo Varro during a press call. Within this, investment in electricity networks was up 6 per cent and power generation was down 5 per cent. Renewables again claimed the largest share of electricity investment, as the chart below shows.
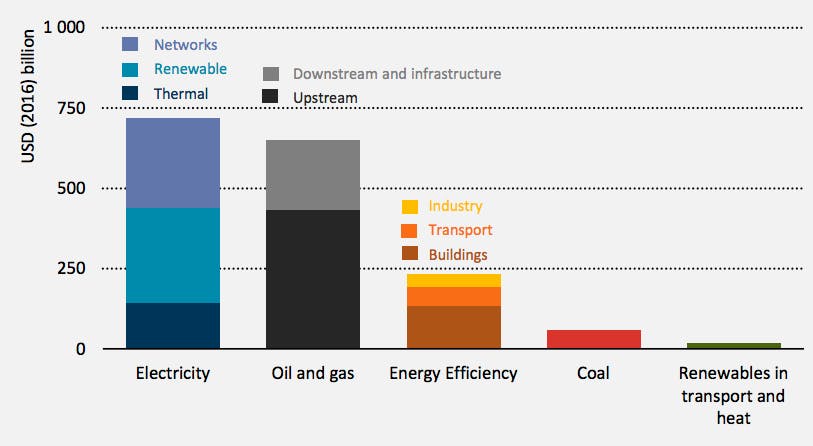
Global energy investment in 2016, by type. Source: IEA World Energy Investment 2017.
Investment in energy efficiency increased by 9 per cent. Europe was the largest destination, though China saw the fastest growth. Within this sector, the IEA says heat pump sales were up 28 per cent, topping 3m for the first time. China is responsible for 95 per cent of recent growth, in part because of city-led policies to clean up dirty air by replacing coal-fired heating systems.
Assuming gas-fired power plants are used to generate the power they need to run, heat pumps are still “several times more efficient” than even the most efficient gas-fired boilers, the IEA says. On this basis, it estimates that the 3m units installed last year avoided 0.75bn cubic metres of gas use, roughly equivalent to the annual demand of Sweden.
Sales of electric vehicles – which the IEA partly counts towards the energy efficiency total – also rose strongly, up 38 per cent to 750,000. China is responsible for half of electric vehicle and 95 per cent of electric bus sales. It also sells around 25m electric scooters each year.
In the US, electric vehicle sales grew 40 per cent, helping them surpass diesels for the first time as the Volkswagen scandal hit sales. Both sectors remain below 2 per cent of total sales.
Oil rebound
Oil-and-gas investment was cut by around a quarter in 2015 and again in 2016, down $345bn across the two years. These cuts, which have been partially met through cost-cutting rather than reduced activity, may have bottomed out and could now rebound at the global level.
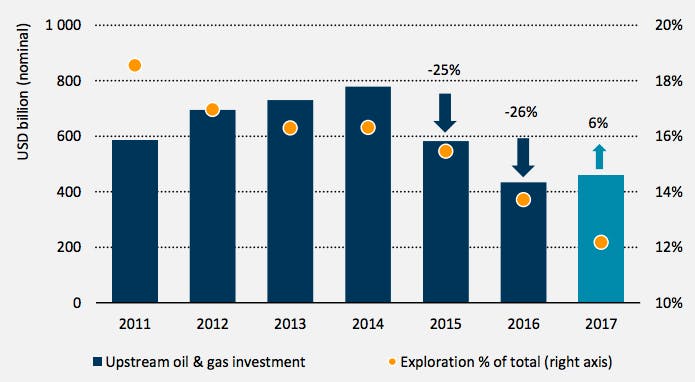
Investment in new oil and gas supplies 2011-2017 and the share of spending going towards exploration. The 2017 figure is estimated based on announced plans. Source: IEA World Energy Investment 2017.
Strategies published by oil firms suggest global investment could rise by 6 per cent in 2017 – and 53 per cent in the US shale sector – though the IEA cautions that continuing low oil prices of below $50 per barrel could force some firms to put investment on hold. Within this total, the IEA says the oil majors – other than Exxon and ConocoPhillips – expect to make further cuts in investment this year.
Nevertheless, with investment in exploration expected to fall further in 2017 (the yellow dots in the chart, above), the IEA repeats its warning on the risk of inadequate supplies. The report says:
“Given depletion of existing fields, the pace of investment in conventional [oil] fields will need to rise to avoid a supply squeeze, even on optimistic assumptions about technology and the impact of nclimate policies on oil demand.”
For example, it argues the electric vehicles sold in 2016 will have cut oil demand by around 0.02 per cent.
Peak coal
Perhaps the most striking of the IEA’s findings is its expectation that investment in the global coal power sector is set for dramatic declines, having passed an all-time peak.
After a “sharp drop” in investment decisions for future coal capacity, falling to “historical lows” in 2016, the IEA expects a “dramatic slowdown in investment in coal-fired power”. This slowdown looks to be largest for the least efficient subcritical coal plants, where investment plans fell 25 per cent.
Varro told a press call:
“This century, so far, was the century of coal. From 2000 onwards, coal was the single biggest source of the growth of power generation, especially in China and India. This coal investment wave, in our view, is coming to an end.
At the very least, it is coming to a pause. Coal-fired power generation capacity which is under construction went down from over 120GW around 10 years ago to only 40GW last year. The decline is especially visible in China, where the Chinese electricity sector is plagued with overcapacity.”
This overcapacity has implications for the global coal construction pipeline, which shrank in 2016, but remains large as a result of historic investment decisions. More significantly, Chinese overcapacity will also weigh on future global coal demand.
The coal construction pipeline is concentrated in China, with 55 per cent of planned plants, yet the IEA says these plants, even if they are built, “may not lead to any significant increase in coal-fired generation due to overcapacity”.
As Varro told journalists: “Arguably, China will not need new coal for quite a long time, possibly never.”
The report adds: “It is becoming clear that Chinese coal demand has peaked and…the outlook for imports [to] India and other countries is uncertain.” For the US, Varro told journalists: “We don’t see any investor appetite [for new coal generation].” Overall, the IEA concludes that investment in coal-fired generation “may have reached an all-time peak in the 2015-2017 period”.
This is despite signs that Chinese firms and banks are increasingly looking to invest in coal plants overseas, as their domestic market is saturated. In fact, even if all of these plans were to go ahead, they would fall far short of domestic Chinese coal investment at its peak.

Global coal power investment decisions, by country. Source: IEA World Energy Investment 2017.
In 2016, the wind and solar capacity installed around the world matched new conventional power capacity for the first time, as the chart above shows. Note the usual caveat that capacity is not the same as generation: wind and solar have lower output per gigawatt (GW) than conventional plant.
Investment plans for oil- and gas-fired power capacity also fell to decade-long lows last year, with the increase in fossil generation, net of closures, reaching 90GW. This is one of the lowest levels this century.
Spending on fossil-fired power generation fell 12 per cent in 2016, the IEA says, mostly due to the “steep” slowdown in new coal plants opening in China, though southeast Asia and Europe also saw declines. These reductions were more than enough to offset a small rise in Indian investment.
Change in India
Intriguingly, it is not only in China that investment plans for new coal have collapsed. The IEA report shows that recent spending on fossil-fuel generation in India has held steady, with a small year-on-year increase in 2016, as the chart below-left shows.
However, annual decisions to invest in future coal capacity have plummeted from a peak of more than 40GW in 2009 to around 5GW in 2016, as the chart below right shows.
More than half of India’s power sector spending in 2016 went towards renewables and power networks, with the decline in investment plans for new coal suggesting this share will rise further.
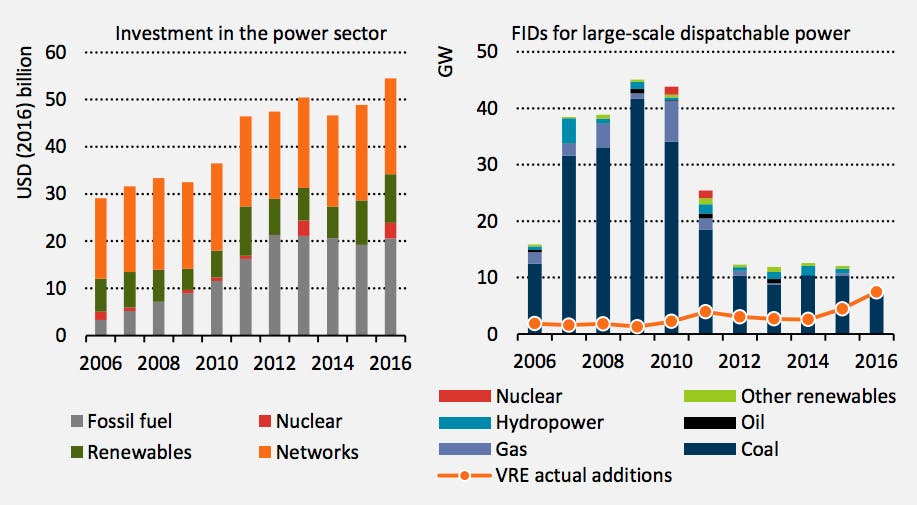
Indian electricity sector investment by year of spending ($bn, left panel) and capacity of new power plants added (GW, right panel). In the right panel, the columns relate to investment decisions taken each year, for future construction of conventional plant, whereas the line relates to actual additions of wind and solar each year. Source: IEA World Energy Investment 2017.
The IEA puts the struggles of the Indian coal sector down to financial problems at major utilities, slower than expected demand growth and increasingly competitive solar prices.
The IEA puts the struggles of the Indian coal sector down to financial problems at major utilities, slower than expected demand growth and increasingly competitive solar prices.
Despite the coal plan slowdown, earlier research has suggested that India’s existing coal pipeline could single-handedly jeopardise the 1.5C goal of the Paris Agreement. As with China, the question remains how many of the planned plants will be built and how many hours they will run.
Carbon chaser
The wind and solar power plants built over the past year alone can generate around 1 per cent of global electricity demand, the report says. Yet low-carbon investment as a whole is failing to keep pace with demand, as the rise of wind and solar has been offset by the fall of hydro and nuclear.
Last year, the IEA reported that new renewable capacity coming online in 2015 could more than match the 1.7 per cent increase in demand. This was partly due to weak electricity demand growth. In 2016, low-carbon additions in total were only able to cover 90 per cent of the 2.3 per cent increase in demand.
On a forward-looking basis, the IEA says that low-carbon investment decisions in each of the past five years have only been sufficient to cover around three-quarters of the average annual increase in global electricity demand in the same period, because of a collapse in nuclear and hydro investment decisions, as the chart below shows.
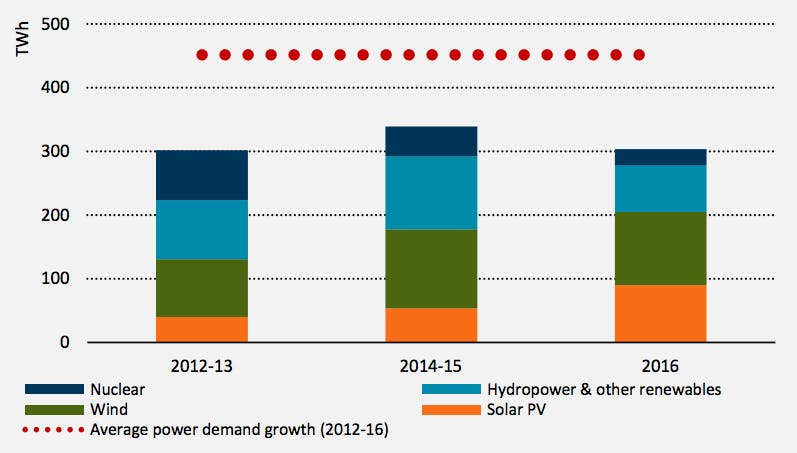
Expected electricity output that will result from low-carbon capacity investment decisions made in each year (columns) and the average increase in global demand between 2012 and 2016 (red dots). Source: IEA World Energy Investment 2017.
Nuclear and hydro are “not doing well at all”, Varro said. He told a press call:
“The unfortunate finding from our analysis is that, in the past five years, the truly remarkable success of wind and solar was only sufficient to compensate for the investment shortfalls in hydro and nuclear.”
The failure of low-carbon supplies to keep up with rising demand means that fossil fuels were needed to make up the difference, with power sector CO2 emissions holding steady because of switching from high-emissions coal to lower-emissions gas.
Inadequate innovation
This shortfall in low-carbon investment versus increasing electricity demand also shows the need for additional energy R&D, Varro said, if the world is to meet the goals agreed under the Paris Agreement on climate change.
Despite a series of high-level commitments in recent years – from the Breakthrough Energy Coalition and Mission Innovation thorugh to the Global Apollo Programme – all promising to raise the profile of, and investment in, energy innovation, the IEA report shows R&D funding has stagnated.
(Note that the IEA says data on R&D spending is sparse and that it has had to compile its estimates from a range of sources. It says: “We acknowledge that this exercise is likely to underestimate considerably the true amount of spending worldwide on all types of energy R&D, because of information gaps.”)

World spending on energy R&D 2012-2015, by source of funding. Source: IEA World Energy Investment 2017.
Under Mission Innovation, for example, launched in 2015 at the Paris climate summit, 19 countries, including the US, UK, India, Japan and Germany, pledged to double governmental clean energy investment within five years.
The data series in the chart above ends in 2015, so there is still time for signatories to step up their efforts, though the IEA says available data “indicate a possible further decline in 2016 [following a small decline from 2014 to 2015]”.
Governments are responsible for around a third of the total and two-thirds of clean energy R&D. Among the 29 IEA member countries – including the US, UK and Germany, but not China or India – energy R&D doubled between 2000 and 2010 before stagnating and remaining below 1980 levels.
These countries put 5 per cent of their total public R&D budgets towards energy in 2015, with these budgets making up 0.1 per cent of public spending. The largest share of their energy R&D goes towards nuclear and basic energy research, with renewables and efficiency joint second.
Conclusion
The IEA’s World Energy Investment 2017 offers a comprehensive overview of the state of the energy sector and how it has been changing. It shows oil-and-gas spend collapsing, allowing the power sector to become the leading destination for investment for the first time.
Meanwhile, its forward-looking view, based on decisions for future spending, suggests coal power investment is set to decline after passing an all-time peak. While a peak in coal investment is not the same as a peak in demand, this keeps the door open to meeting global climate goals.
Yet the IEA also shows how low-carbon energy is failing to keep pace with rising demand, as the success of wind and solar is offset by declining nuclear and hydro.
Finally, if innovation is supposed to help close this climate gap, then the IEA again offers limited cause for optimism: global energy R&D is stagnant, despite a series of high-profile initiatives.
This story was published with permission from Carbon Brief.

