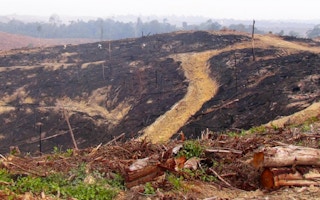
Ministers from five Southeast Asian countries gather in Malaysia next week for urgent talks on combating haze. The meeting follows the recent fires in Sumatra that produced record-breaking air pollution across parts of Indonesia, Singapore, and Malaysia. As this 15th meeting of the Sub-Regional Ministerial Steering Committee on Transboundary Haze Pollution kicks off, in-depth analysis of the patterns and causes of the fires continues. Hopefully the recent crisis will help ensure this meeting is more productive than the previous 14 gatherings, and will move the region towards addressing the root causes of the fires and haze.
In mid-June, at the height of the haze, WRI published a series of three analyses on Indonesia’s forest fires, using NASA fire alert satellite data and official Indonesian government maps of logging, oil palm, and pulpwood plantation concessions. We found that about half of the fire alerts in Sumatra were located inside oil palm and pulpwood plantations, and we identified which companies are responsible for managing these areas. These analyses and their findings have since been replicated, confirmed, and expanded upon by several other organizations, including CIFOR, Eyes on the Forest, Greenpeace, and the Union of Concerned Scientists.
NOTE: The analyses below are based on publicly available data from NASA and the Government of Indonesia. WRI experts have done their best to verify this information, but cannot confirm the accuracy of the original information. For more information on the data provided by NASA’s fire alert system, please see below.
In this fourth installment of WRI’s analysis on the fires, we highlight four new findings about the causes and characteristics of Indonesia’s forest fires, summarized below:
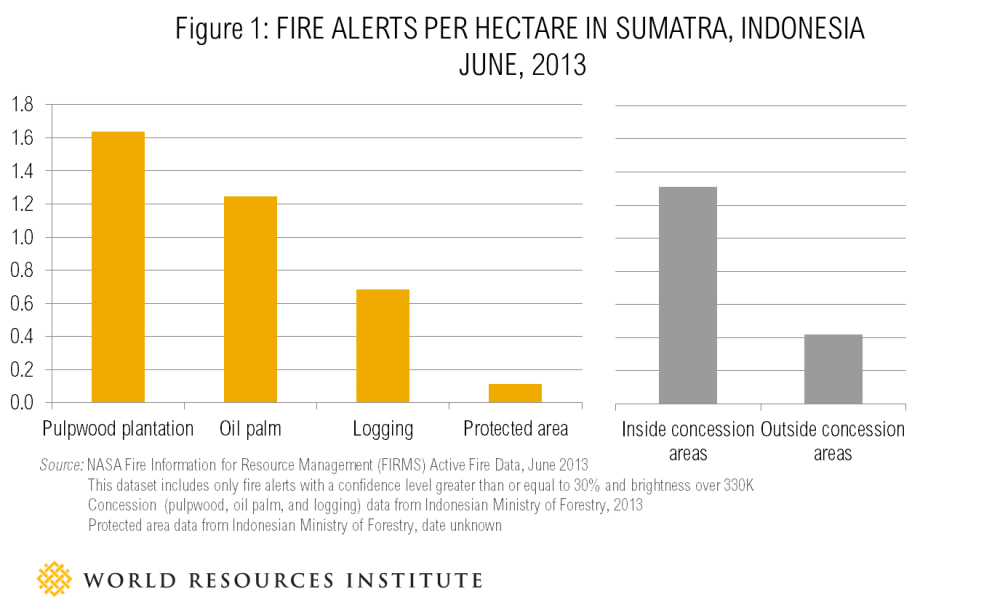
1) Fire alerts are much more concentrated within concession areas.
On a per hectare basis, there are more than three times as many fire alerts inside logging, pulpwood, and oil palm concessions compared with outside concessions. Figure 1 below shows the density of fire alerts for the different land use categories across Sumatra. Our analysis reveals that:
-
The density of fire alerts inside pulpwood concessions is four times higher than the density of fire alerts outside of concession areas. Furthermore, a large number of these concessions are linked with the Sinar Mas (which includes APP) and Raja Garuda Mas (which includes APRIL) groups of companies (a detailed list of company concessions and fire alerts is available here.)
-
The density of fire alerts inside oil palm concessions is three times higher than the density of fire alerts outside of concession areas.
-
The density of fire alerts within protected areas is relatively low compared to all other land use types.
2) There are large discrepancies between concession maps provided by companies and those housed in official Indonesian government databases.
There are significant inconsistencies between concession data from official national or provincial government sources and companies operating in Indonesia. For example, Figure 2 below shows the discrepancies between boundary maps for a concession held by the Sime Darby palm oil company made available to WRI. Sime Darby’s self-reported boundaries represent the Business Use Rights License (known in Indonesia as a Hak Guna Usaha or “HGU” license). Comparing this map to Indonesian government concession maps reveals that:
-
There is great discrepancy between the national government concession boundaries and the license information provided by the company. Furthermore, there is a discrepancy between the boundaries of government concession data between 2010 and 2013.
-
The company further differentiates between the planted or developed part of its version of the concession and the broader concession boundary.
-
In this case, there are many more fire alerts within the wider concession and far fewer or none within the planted and developed area.
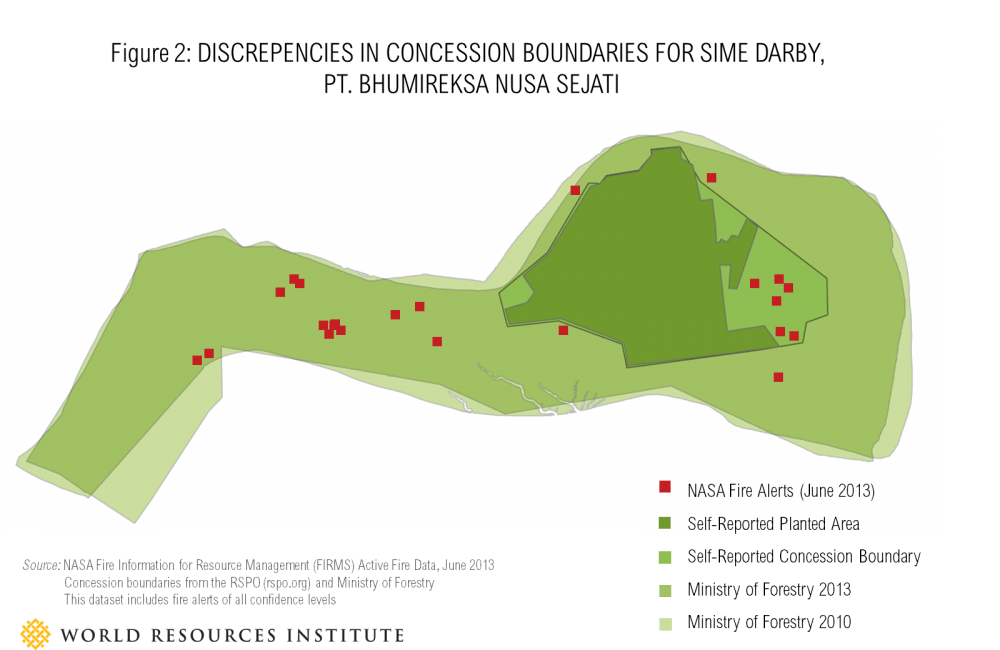
Experts on the ground in Sumatra have indicated to WRI that they would expect to see many more fire alerts in the parts of the concession that have not yet been developed. This supports the findings of earlier analysis by WRI experts. These undeveloped areas within concessions are often areas of conflict and competing land claims between the company, local government, communities, and opportunistic small-scale investors and land speculators. More detailed information about the company HGU licenses, which are not made public, would be very beneficial to efforts to develop further analysis and understand the root causes of the fires. This finding also further reinforces the need to accelerate the Indonesian Government’s important One Map Initiative to clarify boundaries of concessions.
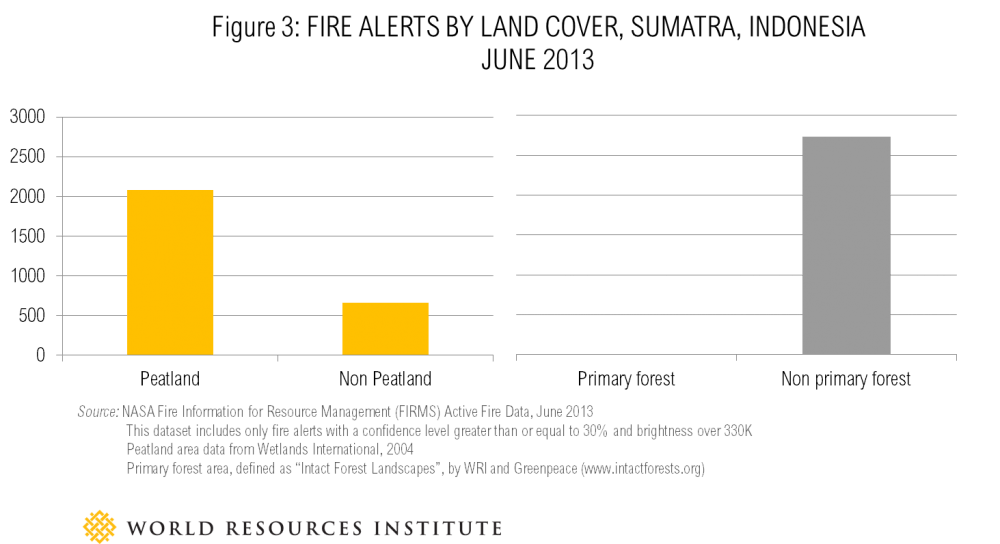
3) Most of the fire alerts took place on peat soils with degraded or secondary forest.
Figure 3 below shows that about two-thirds of the NASA fire alerts during June occurred on peat soils, which are composed of partially decomposed organic matter. Almost none were seen in remaining areas of “intact” or primary forest, which is naturally fire-resistant.
Fires on peat are far more serious from both a human health and environmental perspective than those on mineral or non-peat soils. Peat fires release large amounts of smoke, haze, other pollutants and greenhouse gases. They can burn on for weeks or even months.
4) Most importantly: There is a high risk of repeated fire and haze crises in the coming months and years.
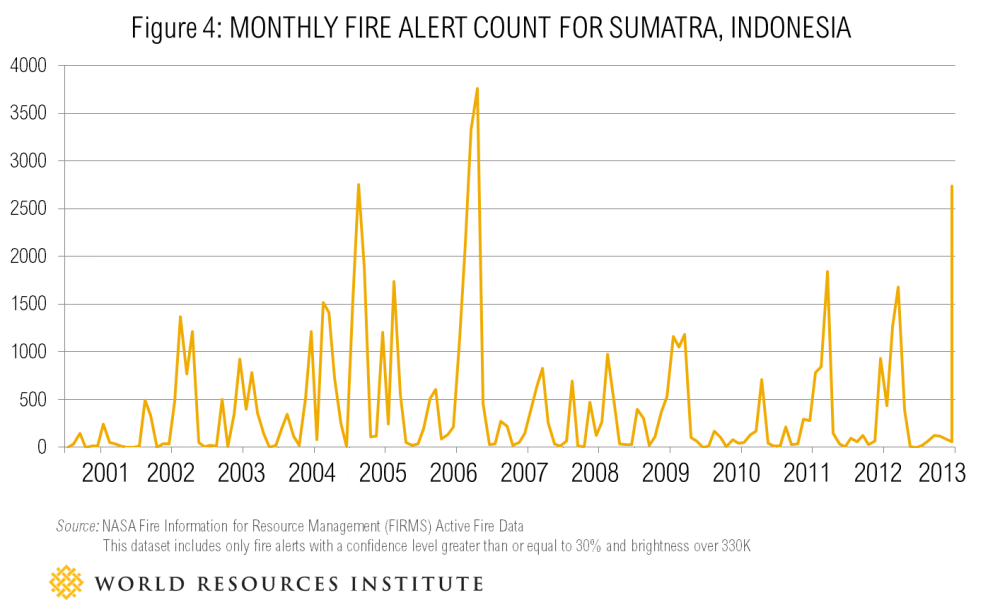
According to WRI analysis, the fire crisis of June 2013 was not an unusual event when compared with the history of fires in Indonesian forests over the past 13 years.
In previous analysis, WRI noted that the record levels of smog experienced in Singapore in June were the result of unusual wind patterns, not unusually high levels of forest fires. Now that June is over, we can see that while a large number of fire alerts occurred that month, there have, in fact, been two worse periods in just the last nine years, occurring in 2005 and 2006. In other words, forest fires in Indonesia are part of a long-standing, endemic problem—one that needs a coordinated and comprehensive solution if fire and haze risks are to be reduced.
It is highly likely that severe burning seasons like the one we have seen over the past several weeks will be repeated. If that happens, Indonesia and its neighbors will again suffer very serious levels of air pollution known to be extremely damaging to human health, and to the country’s vital forest ecosystems. Government ministers meeting in Malaysia have an opportunity next week to make real progress. They should agree on a plan where concession data is consistent between government agencies and companies, criminal burning of forests is investigated and prosecuted, and better management practices are instituted across the region’s forest lands. This is the urgent call that the Ministers surely cannot afford to ignore.
We used NASA’s Active Fire Data to determine the likely location of fires on the ground. This system uses the NASA MODIS satellites, that survey the entire earth every 1-2 days. The sensors on these satellites detect the heat signatures of fires within the infrared spectral band. When the satellite imagery is processed, an algorithm searches for fire-like signatures. When a fire is detected, the system indicates the 1 km2 where the fire occurred with an “alert.” The system will nearly always detect fires of 1,000 m2 in size, but under ideal conditions, can detect flaming fires as small as 50m2.
Since each satellite passes over the equator twice a day, these alerts can be provided in near-real time. Fire alerts are posted on the NASA FIRMS website within 3 hours of detection by the satellite.
The accuracy of fire detection has improved greatly since fire detection systems were first developed for the MODIS satellites. Today, the rate of false positives is 1/10 to 1/1000 what it was under earlier systems first developed in the early 2000s. The algorithm used to detect fires includes steps to eliminate sources of false positives from sun glint, water glint, hot desert environments and others. When the system does not have enough information to detect a fire conclusively, the fire alert is discarded. In general, night observations have higher accuracy than daytime observations. Desert ecosystems have the highest rate of false positives.
Many papers have been published to validate the NASA MODIS active fire alerts for use in various applications. WRI is employing a recommendation for detecting forest clearing fires (described in Morton and Defries, 2008), identifying fires with a Brightness value over 330 Kelvin and a Confidence value > 30% to indicate fires that have a high confidence for being forest-clearing fires. Low confidence fires are lower intensity fires that could either be from non-forest-clearing fire activity (clearing fields or grass burning), or could be older fires that have decreased in intensity (smoldering rather than flaming fires). The use of this classification establishes a higher standard for fire detection than using all fire alerts equally.
Sources:
Morton, D., R. DeFries, J. T. Randerson, L. Giglio, W. Schroeder, and G. van der Werf. 2008. Agricultural intensification increases deforestation fire activity in Amazonia. Global Change Biology 14:2262-2276.
This post originally appeared here. Nigel Sizer is the director of WRI’s Global Forest Initiative. Fred Stolle is programme manager for WRI’s Forest Landscape Objective and Susan Minnemeyer is WRI’s Geographic Information Systems (GIS) lab manager.

